
From Chaos to Clarity.
Collaboration is chaos when data lives in silos
Tandem connects the dots — capturing the invisible data behind collaboration and turning it into measurable intelligence.
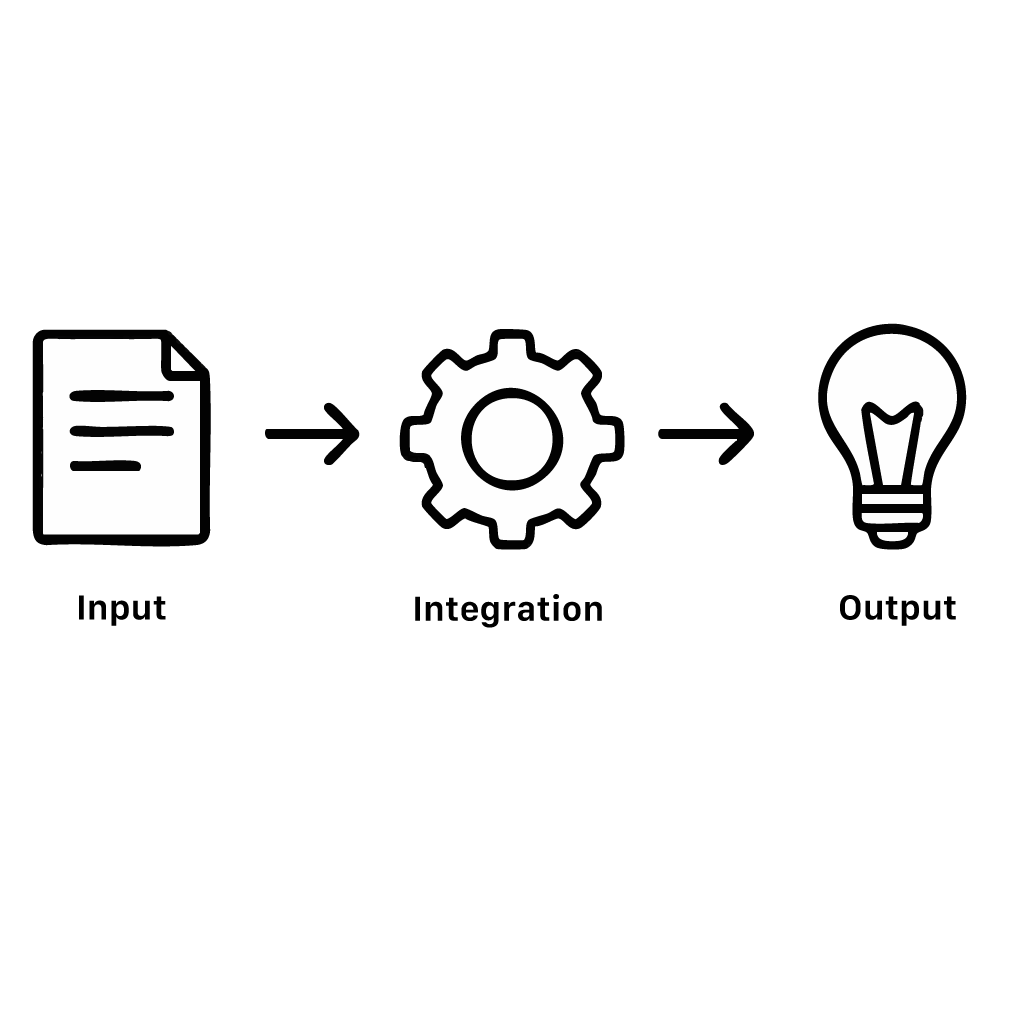
How it works
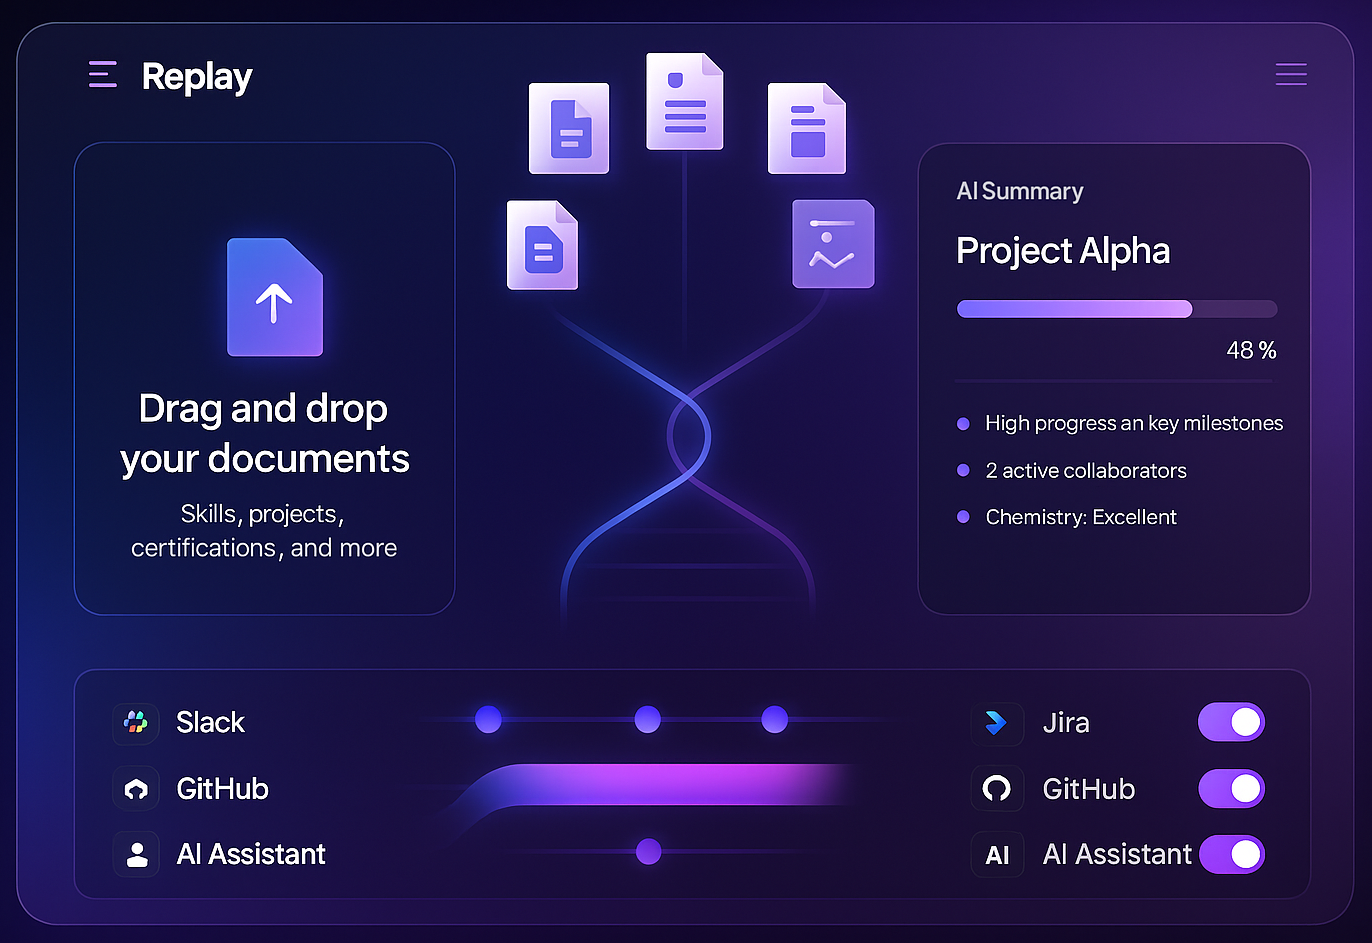
Input
Team member interface
Integration
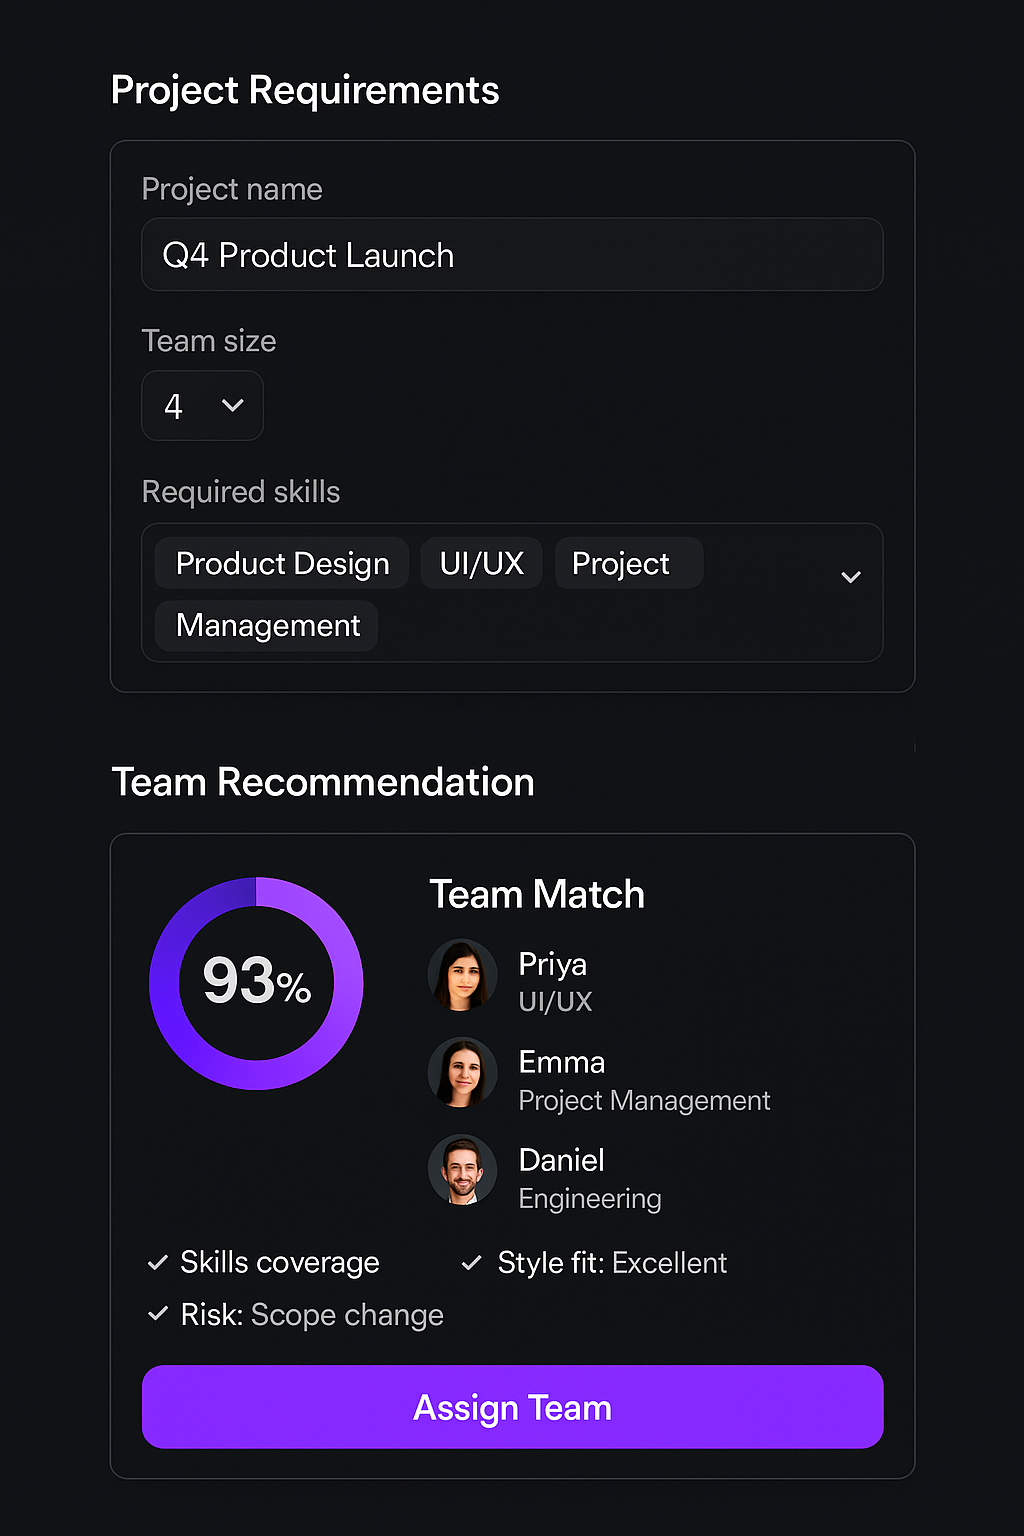


Output
Leadership Interface


Tandem compounds your team’s intelligence automatically.